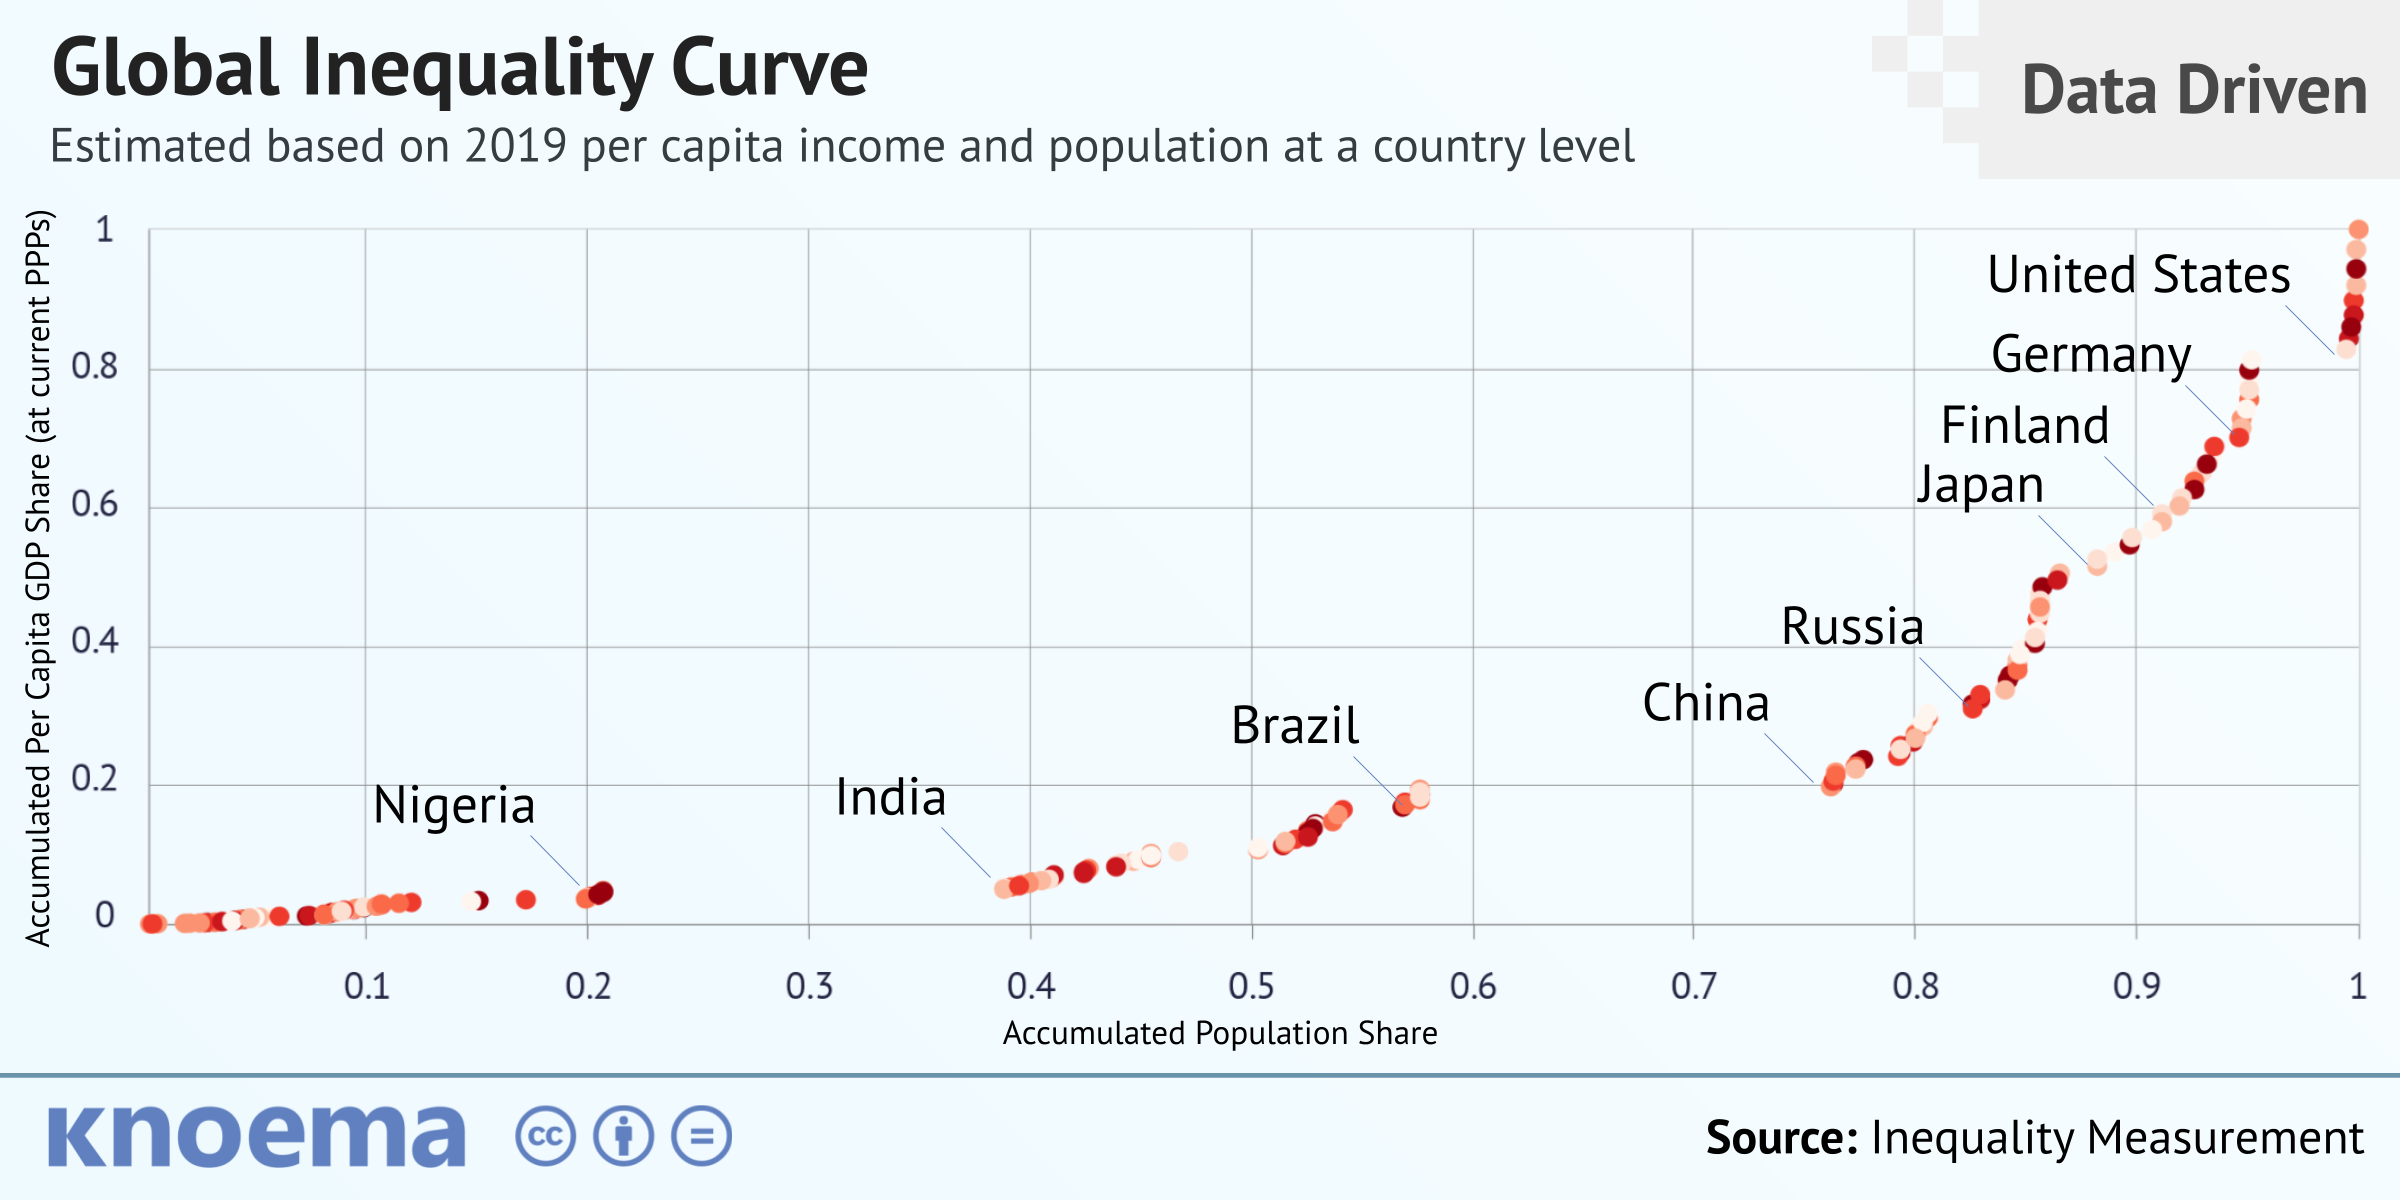
(25 October 2021) The Gini index is one of the traditional measures used to estimate inequality in income distribution at a country level. It shows how far the income distribution between different subsets of a population is from income equality. To estimate a Gini index, national statistical offices (NSOs) need to collect data on personal income for each percentile of population. In this dashboard, the Knoema team uses the same approach to estimate inequality of income distribution at a global level.

  • We used data from the International Monetary Fund on GDP per capita and population for 194 countries, rather than data on per capita income of population percentiles used by NSOs at a country level, to generate a cross-country comparison that reflected countries' shares in the global population.
  • An analysis of a Lorenz curve using estimated 2019 cross-country data shows that global inequality in income distribution is equivalent to a Gini index value of 52 — which indicates extremely high inequality. The poorest 50% of the global population accumulate about 10% of global income, while the richest 20% of the world's population accumulate 70% of global income.
  • To decrease income inequality, individual countries use the mechanisms of fiscal redistribution of income from the richest to the poorest. The same mechanism could hypothetically be implemented at a global level. For example, a 10% global income tax for the 30 richest countries would yield an equivalent of 4.5 trillion international dollars, which could double the per capita income for the 1.3 billion population in the 54 poorest countries.

رؤى ذات صلة من Knoema

Aluminum Price Forecast: 2021, 2022 and Long Term to 2035

(9 June 2021) The aluminum price reached the value of $2,534 per metric ton on May 7th of this year, the highest price since the two-year high in April 2018. The consensus forecast for 2021 from three leading sources (the IMF, the World Bank, and Innovation and Science Australia, an advisory board to the Australian government) is $2,072 per metric ton. The rise in aluminum prices is a result of high demand in China and growing concerns that China's new climate policy, which focuses on greenhouse gas emissions reduction, could limit future supply of the metal. In 2020, China...

Export Concentration Index: A Measure of Economic Vulnerability

The concentration index of exports estimates a country’s reliance on a limited group of commodities as its primary source of foreign exchange income. Ranging from 0 (perfect diversification) to 1 (concentrated on a single product)*, a comparison of index scores to the contribution of natural resources to GDP worldwide shows that countries that are resource-rich tend to have less diversified export bases. Last year Iraq’s export concentration index reached 0.97, driven by its export concentration in mineral fuels, namely oil. Other oil exporters—including Angola, Iran, Kuwait, and...

US Population by Age and Generation in 2020

Gen-Z has overtaken Millennials by nearly 4 million to become the largest generation in the United States. Baby Boomers are the third-largest generation with the population of 69 million persons in 2020. With a current population of around 86 million, the Gen-Z generation is expected to grow to 88 million over the next 20 years because of migration, according to the United Nations' latest World Population Prospects. The boundaries that define generations are not universally agreed, and yet these boundaries carry important implications in business and government. The size,...

The World's Largest Economy: China vs United States

Which is the world's largest economy, China or the United States? As is usual in the field of economics, “It depends.” It depends on the methods used to estimate the size of an economy and to compare one economy to another. Despite modern discussions on refining the calculation of gross domestic product (GDP), the standard measure of an economy’s size and performance, to be more inclusive of economic factors that have been ignored to date, such as environmental and natural resource depletion, there is no commonly accepted alternative to GDP. There are, however, at least two commonly...