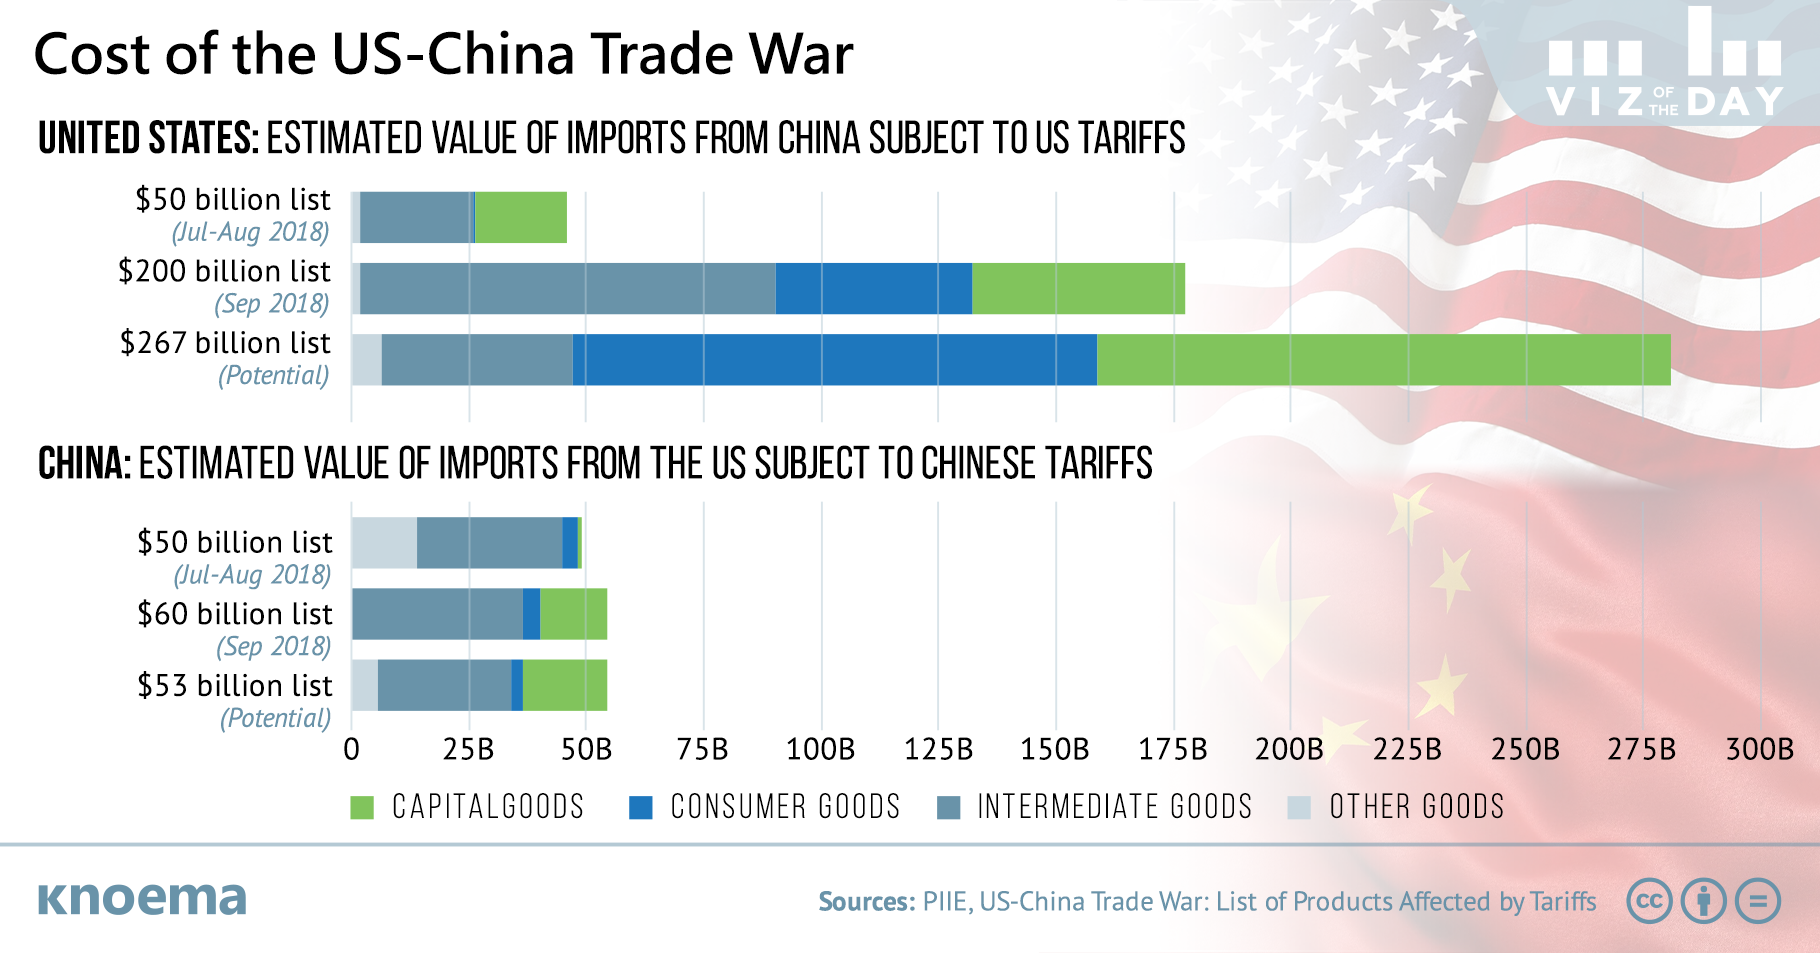
Weeks after US President Donald Trump and Chinese President Xi Jinping agreed to a temporary halt in the US-China trade war, the first positive signs of a return to normal trade relations are emerging. Last week, the China Grain Reserves Corporation (Sinograin) and fellow state-run Chinese enterprise Cofco bought more than 1.5 million tons of US soybeans, the first significant deal since the countries agreed to a 90-day truce from December 1, 2018, to March 1, 2019. The announcement caused a spike in soybean futures to $918.5 a bushel, the highest price since June.

  • Soybeans were one of the most significant Chinese imports from the United States subjected to new tariffs during 2018. In 2017, China imported 31 million tons of soybeans from the United States valued $12.4 billion.
  • Several rounds of tit-for-tat tariff escalation have passed since Trump triggered the trade war in January 2018 by imposing tariffs on products including solar panels and washing machines, followed with more tariffs in March, that time on steel and aluminum articles. All in all, during 2018, the US tariffs increased in scope to the tune of nearly $250 billion worth of US commodity imports from China.
  • China, in turn, imposed tariffs on US agricultural exports (primarily soybeans), motor vehicles, and energy products.

The United States and China are the world's largest economies, and some analysts attribute China’s economic and political rise as a contributing factor to Trump’s trade policies toward the nation. Since 2010 when China became the second largest economy (measured in current US dollars), the US GDP has increased by 30 percent while China’s has nearly doubled. Other factors, however, likely play an important role in US trade policy toward China including the bilateral trade balance and the influence of China's private sector regulations.

  • Bilateral trade imbalance. The US runs a trade deficit with China: US imports from China are five times greater than its exports to China. China typically runs a trade surplus with countries like the US to which it exports manufactured commodities, but it is important to note that based on trade flows measured in value added roughly one third of this trade imbalance is contributed by other countries that send commodities to China for assembly and  final export to the US, according to Bloomberg.
      
  • Market restrictions. Chinese authorities use a variety of methods to protect domestic producers. In some sectors, for example, the government requires foreign corporations to take minority partnership shares in joint businesses instead of initiating greenfield investments. The resulting tech transfer to Chinese enterprises within the partnership can undercut the intellectual property protection of the foreign corporations.

On December 19, the United States and China agreed that policies leading to more balanced trade are important to a de-escalation of the current trade row, but are they sufficiently motivated to do so?

  • Even if the trade war continues, tariffs will have a relatively small direct economic impact on the growth of these countries' economies in the short term. The economies of the United States and China are not highly inter-dependent. China’s exports to the United States represent about 3.6 percent of China’s GDP, while US exports to China are only about 0.7 percent of US GDP.
  • The bigger question on long-term economic consequences might be better answered by markets. If business confidence and financial markets are affected as a result of trade tensions, then China and the United States could lose 1.6 and 1 percentage points of real GDP growth respectively in the next two years, according to the IMF.

رؤى ذات صلة من Knoema

China Trade Data | Latest Official Statistics

(October 2019) China and the United States reached a partial trade deal on Friday, October 11, with the US agreeing to forgo further tariff escalation in exchange for China agreeing to resume purchases of US farm products. However, even if trade terms improve between the countries, recent preliminary figures released by China's customs office suggest Chinese exports hurt by the trade war will need time to recover to 2018 levels. Since the beginning of 2019, China exported $348 billion to the United States, 11.3 percent less than during the same period of 2018.China's exports...

World Trade Uncertainty Weighing On Global Growth

Recent analysis from the IMF cites increasing uncertainty caused by trade tensions as a primary driver of sluggish global growth, a trend which moved the IMF to issue a downward revision to its global GDP growth forecast in the July edition of the World Economic Outlook. According to IMF estimates, the escalation of trade uncertainty observed this year could consume around 0.75 percentage points of global growth in 2019. To track trade tensions globally, the IMF and Stanford University teamed up to develop the World Trade Uncertainty Index (WTU).* This index measures trade...

US Agricultural Exports to China Falling, Farmers Seek New Markets

Ask any American soybean farmer about current market conditions and US-China trade frictions will bubble up in the conversation. After the late June meeting between presidents Xi Jinping and Donald Trump in Osaka, Trump assured American farmers that trade talks would resume and that China would buy a tremendous amount of food and agricultural products very soon. Yet, in the month since, no significant purchases have been announced and no information is publicly available on large purchases in the offing, especially now, as the trade-war escalated again with the new 10-percent...

Export Concentration Index: A Measure of Economic Vulnerability

The concentration index of exports estimates a country’s reliance on a limited group of commodities as its primary source of foreign exchange income. Ranging from 0 (perfect diversification) to 1 (concentrated on a single product)*, a comparison of index scores to the contribution of natural resources to GDP worldwide shows that countries that are resource-rich tend to have less diversified export bases. Last year Iraq’s export concentration index reached 0.97, driven by its export concentration in mineral fuels, namely oil. Other oil exporters—including Angola, Iran, Kuwait, and...