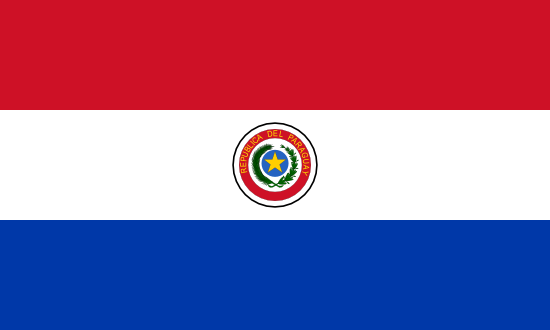
باراجواي

  • السكان والأشخاص:6,971,540 (2025)
  • المساحة ، كم مربع:396,012
  • الناتج المحلي الإجمالي للفرد ، بالدولار الأمريكي:6,276 (2023)
  • الناتج المحلي الإجمالي ، مليار دولار أمريكي حالي:43.0 (2023)
  • مؤشر GINI:45.1 (2022)
  • تصنيف سهولة ممارسة الأعمال:125

All datasets: 2 A B C E F G H I L M N P R S T U W ا
  • 2
  • A
    • أيلول 2023
      المصدر: International Energy Agency
      تم التحميل بواسطة: Knoema
      تم الوصول في: 06 تشرين الأول, 2023
      تحديد مجموعة بيانات
      World Electricity access database Hundreds of millions of people have gained access to modern energy over the last two decades, especially in China and India. Rapid economic development in several developing countries, increasing urbanisation and ongoing energy access programmes have been important factors in this achievement. The IEA Access to Energy database provides a snapshot of progress made toward meeting the ultimate goal of universal access. Note: For indicator population without access, value 1 represent <1 except Botswana, Guatemala countries
  • B
    • آب 2024
      المصدر: International Monetary Fund
      تم التحميل بواسطة: Knoema
      تم الوصول في: 16 تشرين الأول, 2024
      تحديد مجموعة بيانات
      Data cited at: Balance of Payments(BOP) and International Investment Position(IIP), World and Regional Aggregates, The International Monetary Fund BOPSY Global Tables aggregate country data by major balance of payments components and by international investment position (IIP) data for (i) Net IIP and (ii) Total Assets and Total Liabilities. Data for countries, country groups, and the world are provided. In addition to data reported by countries as shown in BOPSY, balance of payments data are provided for international organizations in BOPSY Global Tables. The BOPSY Global Tables include, in addition to reported data, data derived in a few instances indirectly from published sources.
    • كانون الأول 2022
      المصدر: Global Knowledge Partnership on Migration and Development
      تم التحميل بواسطة: Knoema
      تم الوصول في: 15 شباط, 2023
      تحديد مجموعة بيانات
      This data set provides a snapshot of migration and remittances for all countries, regions and income groups of the world, compiled from available data from various sources
  • C
    • شباط 2025
      المصدر: Transparency International
      تم التحميل بواسطة: Knoema
      تم الوصول في: 12 شباط, 2025
      تحديد مجموعة بيانات
      Data cited at https://www.transparency.org/en/cpi/2020/index/nzl by Transparency International is licensed under CC-BY-ND 4.0. Global Corruption Barometer is the largest world-wide public opinion survey on corruption. see more at https://www.transparency.org/en/cpi/2020/index/nzl Transparency International(TI) defines corruption as the abuse of entrusted power for private gain. This definition encompasses corrupt practices in both the public and private sectors. The Corruption Perceptions Index (CPI) ranks countries according to the perception of corruption in the public sector. The CPI is an aggregate indicator that combines different sources of information about corruption, making it possible to compare countries. The CPI ranks almost 200 countries by their perceived levels of corruption, as determined by expert assessments and opinion surveys.
    • أيار 2020
      المصدر: Eurostat
      تم التحميل بواسطة: Knoema
      تم الوصول في: 02 حزيران, 2020
      تحديد مجموعة بيانات
      Eurostat Dataset Id:med_ag2 The focus of this domain is on the following countries:Algeria, Egypt, Israel, Jordan, Lebanon, Morocco, Palestinian Authority, Syria, Tunisia. Data are provided for over 1000 indicators depending on the country.   The data for the Mediterranean partner countries are supplied by and under the responsibility of the national statistical authorities  of each of the countries or territories. The data and their denomination in no way constitute the  expression of an opinion by the European Commission on the  legal status of a country or territory or on the delimitation of its frontiers. Â
  • E
    • كانون الثاني 2025
      المصدر: Atlas of Economic Complexity, Growth Lab Harvard University
      تم التحميل بواسطة: Knoema
      تم الوصول في: 06 كانون الثاني, 2025
      تحديد مجموعة بيانات
      Data cited at:  Retrieved from-https://atlas.cid.harvard.edu/rankings/product
    • آذار 2009
      المصدر: Eurostat
      تم التحميل بواسطة: Knoema
      تم الوصول في: 27 كانون الثاني, 2025
      تحديد مجموعة بيانات
      Eurostat Dataset Id:cens_01reisco The tables presented in the topic of educational level cover the total population for 31 countries (for more information on received tables and geographic coverage, see "2001 Census Round - Tables Received" in the Annex at the bottom of the page). The level of completeness of the tables depends largely on the availability of data at the respective national statistical institutes. There are four ways of collecting census data, namely: - the traditional method of using census questionnaires (exhaustive census); - the method of using registers and/or other administrative sources; - a combination of registers and/or other administrative sources and - surveys (complete enumerations or sample surveys). Other methods (other mixed census or micro-census) can be used as well. Details for the method employed by each country are provided in "2001 Census Method"in the Annex at the bottom of the page. In the same table you can find the dates on which the census was carried out in each country.
    • كانون الثاني 2025
      المصدر: U.S. Department of Agriculture
      تم التحميل بواسطة: Knoema
      تم الوصول في: 29 كانون الثاني, 2025
      تحديد مجموعة بيانات
      Note: Data is no longer being updated on source: https://www.ers.usda.gov/topics/international-markets-us-trade/international-consumer-and-food-industry-trends/#data The Dataset contain data on expenditures on food (including nonalcoholic beverages), alcoholic beverages, and tobacco as a share of consumer expenditures on all goods and services for 86 countries. The tables also contain data on per capita consumer expenditures on goods and services, as well as per capita food expenditures for these countries. Data is available for the 104 countries for which this type of information is currently available in the source database, Euromonitor International. All expenditure data are in current U.S. dollars.
  • F
    • تشرين الثاني 2024
      المصدر: United Nations Conference on Trade and Development
      تم التحميل بواسطة: Jonathan Kilach
      تم الوصول في: 16 كانون الثاني, 2025
      تحديد مجموعة بيانات
      This dataset contains information on foreign direct investment (FDI) inward and outward flows and stock, expressed in millions of dollars. Foreign direct investment (FDI) is an investment made by a resident enterprise in one economy (direct investor or parent enterprise) with the objective of establishing a lasting interest in an enterprise that is resident in another economy (direct investment enterprise or foreign affiliate). The lasting interest implies the existence of a long-term relationship between the direct investor and the direct investment enterprise and a significant degree of influence on the management of the enterprise. The ownership of 10% or more of the voting power of a direct investment enterprise by a direct investor is evidence of such a relationship. FDI flows comprise mainly three components:acquisition or disposal of equity capital. FDI includes the initial equity transaction that meets the 10% threshold and all subsequent financial transactions and positions between the direct investor and the direct investment enterprise;reinvestment of earnings which are not distributed as dividends;inter-company debt.   FDI flows are transactions recorded during the reference period (typically year or quarter). FDI stocks are the accumulated value held at the end of the reference period (typically year or quarter). In 2014, many countries implemented the new guidelines for the compilation of FDI data based on the Sixth edition of the Balance of Payments and International Investment Position Manual (BPM6) and the Fourth edition of OECD Benchmark Definition of Foreign Direct Investment (BD4). One of the major changes introduced in BPM6 and BD4 is the presentation of FDI statistics on an asset/liability basis instead of the directional principle (as recommended by the previous editions of these guidelines). On an asset/liability basis, direct investment statistics are organized according to whether the investment relates to an asset or a liability for the reporting country. Under the directional principle, the direct investment statistics are organized according to the direction of the investment for the reporting country - either inward or outward. The two presentations differ in their treatment of reverse investment (reverse investment is when an affiliate provides loans to its parent). Under the directional presentation, reverse investment is subtracted to derive the total outward or inward investment of the reporting economy. Therefore, FDI statistics on an asset/liability basis tends to be higher than those under the directional principle, but such is not always the case. While the presentation on an asset/liability basis is appropriate for macroeconomic analysis (i.e. the impact on the balance of payments), the presentation on directional principle is more appropriate to assist policymakers and government officials to formulate investment policies. This is because the presentation of the FDI data on directional basis reflects the direction of influence by the foreign direct investor underlying the direct investment: inward or outward direct investment. FDI data in this table are on directional principle, unless otherwise indicated.
    • كانون الثاني 2025
      المصدر: National Institute of Statistics of Rwanda
      تم التحميل بواسطة: Knoema
      تم الوصول في: 19 آذار, 2025
      تحديد مجموعة بيانات
    • شباط 2025
      المصدر: National Statistics Institute, Cabo Verde
      تم التحميل بواسطة: Knoema
      تم الوصول في: 21 شباط, 2025
      تحديد مجموعة بيانات
    • آذار 2025
      المصدر: Kuwait Central Statistical Bureau
      تم التحميل بواسطة: Knoema
      تم الوصول في: 26 آذار, 2025
      تحديد مجموعة بيانات
    • آذار 2025
      المصدر: Lesotho Bureau of Statistics
      تم التحميل بواسطة: Jonathan Kilach
      تم الوصول في: 21 آذار, 2025
      تحديد مجموعة بيانات
      Foreign Trade Statistics of Lesotho
    • آب 2024
      المصدر: Central Bank of Libya
      تم التحميل بواسطة: Knoema
      تم الوصول في: 25 أيلول, 2024
      تحديد مجموعة بيانات
    • آذار 2025
      المصدر: National Institute of Statistics, Mali
      تم التحميل بواسطة: Knoema
      تم الوصول في: 19 آذار, 2025
      تحديد مجموعة بيانات
    • كانون الثاني 2025
      المصدر: Office of National Statistics, Mauritania
      تم التحميل بواسطة: Knoema
      تم الوصول في: 13 شباط, 2025
      تحديد مجموعة بيانات
         
    • كانون الأول 2024
      المصدر: Ministry of Development Planning and Statistics, Qatar
      تم التحميل بواسطة: Knoema
      تم الوصول في: 19 شباط, 2025
      تحديد مجموعة بيانات
      Qatar: Foreign Merchandise Trade The foreign trade data reflects a clear image of the stages of economical growth in the State of Qatar, as it shows the commodities flow in the shape of national exports, re-exports, and imports to / from different countries of the world. The foreign trade tables contains detailed data for visible imports by country of origin and Exports and Re-Exports by country of destination. The commodity tables are classified by sections and items of the Harmonized System (H.S.) issued by World Customs Organization, which was adapted according to GCC’s needs to meet the actual movement of foreign trade in the region, in addition to other statistical tables. The customs declaration entry issued by Customs Department is the main source of statistical information according to the Special Trade System adopted by the State of Qatar.
  • G
    • شباط 2024
      المصدر: United Nations Conference on Trade and Development
      تم التحميل بواسطة: Knoema
      تم الوصول في: 28 شباط, 2024
      تحديد مجموعة بيانات
      This dataset provides information on gross domestic product (GDP), total and per capita at current and constant (2010) prices also it contains annual average growth rates of gross domestic product (GDP), total and per capita, in per cent. The total GDP is expressed in millions of dollars, while GDP per capita is expressed in dollars.
    • كانون الأول 2024
      المصدر: TRACE International
      تم التحميل بواسطة: Knoema
      تم الوصول في: 26 كانون الأول, 2024
      تحديد مجموعة بيانات
      'The TRACE Matrix measures business bribery risk in all countries. Developed in collaboration with RAND Corporation, the TRACE Matrix provides the business community with a powerful new tool for anti-bribery risk assessment. It assesses countries across four domains - Business Interactions with Government, Anti-bribery Laws and Enforcement, Government and Civil Service Transparency, and the Capacity for Civil Society Oversight, including the role of the media - as well as nine sub-domains. Business interactions with government includes the sub-domains of “contact with government,” “expectation of paying bribes” and “regulatory burden.” These indicators capture aspects of the “keys with government” that TRACE identified as very important for business bribery through regulatory and business interviews they conducted. Anti-corruption laws enacted by a country and information about enforcement of those laws. Government and civil service transparency, which includes indicators concerning whether government budgets are publicly available and whether there are regulations addressing conflicts of interest for civil servants. Information concerning the extent of press freedom and social development, both of which serve as indicators of a robust civil society that can provide government oversight. The overall country risk score is a combined and weighted score of four domains . For each of these four "domains" (and related sub-domains), the TRACE Matrix aggregates relevant data obtained from leading public interest and international organizations, including the United Nations, the World Bank and the World Economic Forum. Based on statistical analysis of this information, each country is assigned not only an overall score between 1 and 100 — with 100 representing the greatest risk — but also scores for each of the four domains and nine sub-domains. '  TRANSLATE with xEnglishArabicHebrewPolishBulgarianHindiPortugueseCatalanHmong DawRomanianChinese SimplifiedHungarianRussianChinese TraditionalIndonesianSlovakCzechItalianSlovenianDanishJapaneseSpanishDutchKlingonSwedishEnglishKoreanThaiEstonianLatvianTurkishFinnishLithuanianUkrainianFrenchMalayUrduGermanMalteseVietnameseGreekNorwegianWelshHaitian CreolePersian  TRANSLATE with COPY THE URL BELOW BackEMBED THE SNIPPET BELOW IN YOUR SITEEnable collaborative features and customize widget: Bing Webmaster PortalBack
    • كانون الثاني 2021
      المصدر: Germanwatch
      تم التحميل بواسطة: Knoema
      تم الوصول في: 25 كانون الثاني, 2021
      تحديد مجموعة بيانات
      Data cited at: Germanwatch-https://www.germanwatch.org/en/cri 
    • كانون الأول 2020
      المصدر: World Economic Forum
      تم التحميل بواسطة: Knoema
      تم الوصول في: 28 كانون الأول, 2020
      تحديد مجموعة بيانات
      Data cited at: The World Economic Forum https://www.weforum.org/ Topic: The Global Competitiveness Report Publication URL: https://www.weforum.org/reports/the-global-competitiveness-report-2020 License: https://creativecommons.org/licenses/by-nc-nd/4.0/legalcode
    • نيسان 2024
      المصدر: DHL
      تم التحميل بواسطة: Knoema
      تم الوصول في: 03 أيار, 2024
      تحديد مجموعة بيانات
      DHL Global Connectedness Report, released in partnership with New York University’s Stern School of Business, unveils a remarkable finding: Globalization reached a record high in 2022 and has remained near that level in 2023
    • حزيران 2020
      المصدر: World Bank
      تم التحميل بواسطة: Knoema
      تم الوصول في: 16 تشرين الأول, 2020
      تحديد مجموعة بيانات
      The Global Consumption Database is a one-stop source of data on household consumption patterns in developing countries. It is designed to serve a wide range of users—from researchers seeking data for analytical studies to businesses seeking a better understanding of the markets into which they are expanding or those they are already serving.   The data are based on national household surveys, which collect information for a group of households representative of the entire country. For each of the countries covered, the resulting datasets have been used to calculate the share of the population at different levels of consumption.   Four levels of consumption are used to segment the market in each country: lowest, low, middle, and higher. They are based on global income distribution data, which rank the global population by income per capita. The lowest consumption segment corresponds to the bottom half of the global distribution, or the 50th percentile and below; the low consumption segment to the 51th–75th percentiles; the middle consumption segment to the 76th–90th percentiles; and the higher consumption segment to the 91st percentile and above.   The Global Consumption Database is the most comprehensive data source to date on consumer spending patterns in developing countries. It builds on the 2007 report The Next 4 Billion, published by IFC (a member of the World Bank Group) and the World Resources Institute.
    • كانون الأول 2019
      المصدر: Global Entrepreneurship and Development Institute
      تم التحميل بواسطة: Knoema
      تم الوصول في: 20 كانون الثاني, 2020
      تحديد مجموعة بيانات
      Global Entrepreneurship Index provides information about global entrepreneurship sub Index ranks and scoring of all countries. It also provides information about certain indicators like attitudes, abilities and aspirations with their ranks and scores
    • أيلول 2024
      المصدر: United Nations Statistics Division
      تم التحميل بواسطة: Knoema
      تم الوصول في: 07 كانون الثاني, 2025
      تحديد مجموعة بيانات
    • شباط 2025
      المصدر: Institute for Health Metrics and Evaluation
      تم التحميل بواسطة: Knoema
      تم الوصول في: 26 آذار, 2025
      تحديد مجموعة بيانات
      Research by the Global Burden of Disease Health Financing Collaborator Network produced projected health spending estimates for 2022-2050 for 204 countries and territories. The estimates cover total health spending, health spending disaggregated by source into three domestic financing source categories (government, out-of-pocket, and prepaid private), and development assistance for health (DAH). Retrospective health spending estimates for 1995-2022 and key covariates (including GDP per capita, total government spending, total fertility rate, and fraction of the population older than 65 years) were used to forecast GDP and health spending through 2050. Estimates are reported in constant 2022 US dollars, constant 2022 purchasing-power parity-adjusted (PPP) dollars, and as a percent of gross domestic product. 
    • حزيران 2024
      المصدر: World Economic Forum
      تم التحميل بواسطة: Knoema
      تم الوصول في: 20 حزيران, 2024
      تحديد مجموعة بيانات
      Data cited at: The World Economic Forum https://www.weforum.org/ Topic: Global Gender Gap Report 2023 Publication URL: https://www.weforum.org/reports/global-gender-gap-report-2023 License: https://creativecommons.org/licenses/by-nc-nd/4.0/legalcode   The Global Gender Gap Index annually benchmarks the current state and evolution of gender parity across four key dimensions (Economic Participation and Opportunity, Educational Attainment, Health and Survival, and Political Empowerment). It is the longest-standing index tracking the progress of numerous countries’ efforts towards closing these gaps over time since its inception in 2006. This year, the 17th edition of the Global Gender Gap Index benchmarks gender parity across 146 countries, providing a basis for robust cross country analysis.
    • حزيران 2024
      المصدر: World Economic Forum
      تم التحميل بواسطة: Knoema
      تم الوصول في: 19 حزيران, 2024
      تحديد مجموعة بيانات
      Data cited at: The World Economic Forum https://www.weforum.org/ Topic: The Global Gender Gap Report Publication URL: https://www.weforum.org/reports License: https://creativecommons.org/licenses/by-nc-nd/4.0/legalcode   This dataset provides education and skills related indicators that present in Global Gender Gap Report
    • أيلول 2024
      المصدر: Emission Database for Global Atmospheric Research
      تم التحميل بواسطة: Akshata Biradarpatil Venkappa B Patil
      تم الوصول في: 04 تشرين الأول, 2024
      تحديد مجموعة بيانات
      Direct greenhouse gases: Carbon Dioxide (CO2), Methane (CH4), Nitrous Oxide (N2O), Hydrofluorocarbons (HFC-23, 32, 125, 134a, 143a, 152a, 227ea, 236fa, 245fa, 365mfc, 43-10-mee), Perfluorocarbons (PFCs: CF4, C2F6, C3F8, c-C4F8, C4F10, C5F12, C6F14, C7F16), Sulfur Hexafluoride (SF6), Nitrogen Trifluoride (NF3) and Sulfuryl Fluoride (SO2F2). Emissions are calculated by individual countries using country-specific information. The countries are organized in different world regions for illustration purposes. Emissions of some small countries are presented together with other countries depending on country definition and availability of activity statistics. Source: European Commission, Joint Research Centre (JRC)/PBL Netherlands Environmental Assessment Agency.
    • أيلول 2024
      المصدر: Global Hunger Index
      تم التحميل بواسطة: Knoema
      تم الوصول في: 11 تشرين الأول, 2024
      تحديد مجموعة بيانات
      Global Hunger Index, 2024 The 2024 Global Hunger Index (GHI) score for the world is 18.3, considered moderate, down only slightly from the 2016 score of 18.8. This global score obscures wide variations in hunger by region. The situation is most severe in Africa South of the Sahara and South Asia, where hunger remains serious. Africa South of the Sahara’s high GHI score is driven by the highest undernourishment and child mortality rates of any region by far. In South Asia, serious hunger reflects rising undernourishment and persistently high child undernutrition, driven by poor diet quality, economic challenges, and the increasing impact of natural disasters.
    • أيلول 2024
      المصدر: Global Innovation Index
      تم التحميل بواسطة: Knoema
      تم الوصول في: 07 تشرين الأول, 2024
      تحديد مجموعة بيانات
      The Global Innovation Index 2024 captures the innovation ecosystem performance of 133 economies and tracks the most recent global innovation trends. The Global Innovation Tracker 2024 provides a comprehensive analysis of the current state of global innovation. Findings highlight progress as well as challenges across four key stages of the innovation cycle: science and innovation investment, technological progress, technology adoption, and the socioeconomic impact of innovation.
    • تشرين الثاني 2024
      المصدر: Knowledge4All
      تم التحميل بواسطة: Knoema
      تم الوصول في: 04 كانون الأول, 2024
      تحديد مجموعة بيانات
      Data cited at:  Knowledge4All, United Nations Development Program & Mohammed Bin Rashid Al Maktoum Knowledge Foundation.
    • نيسان 2024
      المصدر: International Finance and Macroeconomics (IFM) Milken Institute
      تم التحميل بواسطة: Knoema
      تم الوصول في: 11 نيسان, 2024
      تحديد مجموعة بيانات
      The Global Opportunity Index (GOI) answers a pressing need for information that's vital to a thriving global economy like what policies can governments pursue to attract foreign direct investment (FDI), expand their economies, and accelerate job creation, everything multinational companies, other investors, and development agencies need to know before making large-scale, long-term capital commitments.   Methodology The GOI considers economic and financial factors that influence investment activities as well as key business, legal and regulatory policies that governments can modify to support and often drive investments. Overall, it tracks countries’ performance on more than 50 variables aggregated in five categories, each measuring an aspect of a country’s attractiveness for investors: (1) its economic performance; (2) the ability for investors to access financial services; (3) the cost of doing business; (4) the level of support its institutions provide to businesses; and (5) the extent to which its institutions, policies, and legal system facilitate international integration.
    • حزيران 2024
      المصدر: Institute for Economics and Peace
      تم التحميل بواسطة: Knoema
      تم الوصول في: 20 حزيران, 2024
      تحديد مجموعة بيانات
      Data cited at: Institute for Economics and Peace retrieved from Vision of Humanity  The Global Peace Index 2022
    • كانون الأول 2024
      المصدر: SolAbility
      تم التحميل بواسطة: Knoema
      تم الوصول في: 24 كانون الأول, 2024
      تحديد مجموعة بيانات
      Highlights of the  Global Sustainable Competitiveness Report 2024:The GSCI is now based on a new calculation methodology incorporating 216 quantitative indicators that uses (but is not based upon) AI tools to clean data, and analyse trends and correlations • Scandinavia continues to make its mark on the Sustainable Competitiveness Index: of the top 5 spots, 4 are Scandinavian. Sweden keeps topping the Index, followed by Finland and Denmark; • Northern European countries dominate the top 20 rankings; • Only two countries in the Top 20 are not European: Japan on 10, and South on 16; • China is ranked 28, exceling in Intellectual Capital but lags in Natural Capital and Resource Efficiency, albeit with encouraging signs of efficiency improvements; • The USA is ranked 35, performing comparatively poor in resource efficiency and social capital, reflecting a decline that could potentially undermine the global status of the US in the future; • Germany ranks 9, France 8, and the UK 14; • Brazil ranks 52, India 90, and Nigeria – Africa’s most populous nation – 145; • Some of the least developed nations have a considerable higher GSCI ranking than their GDP would suggest (e.g. Vietnam, Colombia, Peu, Nepal, Bhutan, Bolivia, …) • Asian nations (South Korea, Japan, Singapore, and China) lead the Intellectual Capital Index – the basis of innovation. • The Social Capital Index ranking is headed by Northern European (Scandinavian) countries, the result of economic growth combined with a commonly accepted social consensus • Countries savaged by violent conflicts (Sudan, Yemen, Eritrea, Libya, Somalia, Afghanistan) are at the bottom of the GSCI
    • تشرين الثاني 2023
      المصدر: INSEAD
      تم التحميل بواسطة: Jonathan Kilach
      تم الوصول في: 24 كانون الثاني, 2024
      تحديد مجموعة بيانات
      Data cited at: INSEAD-https: //knowledge.insead.edu/talent-management/global-talent-competitiveness-index-2932
    • شباط 2025
      المصدر: Institute for Economics and Peace
      تم التحميل بواسطة: Knoema
      تم الوصول في: 12 آذار, 2025
      تحديد مجموعة بيانات
      Data cited at:  Institute for Economics & Peace and available from http://visionofhumanity.org/reports Note: The Year of data has been considered as year of publication, for example 2020 report is considered as year 2020.   The Global Terrorism Index (GTI) is a comprehensive study which accounts for the direct and indirect impact of terrorism in 163 countries in terms of its effect on lives lost, injuries, property damage and the psychological aftereffects of terrorism. This study covers 99.6 per cent of the world's population. It aggregates the most authoritative data source on terrorism today, the Global Terrorism Database (GTD) collated by the National Consortium for the Study of Terrorism and Responses to Terrorism (START) into a composite score in order to provide an ordinal ranking of nations on the negative impact of terrorism. The GTD is unique in that it consists of systematically and comprehensively coded data on domestic as well as international terrorist incidents and now includes more than 140,000 cases.  
    • آب 2024
      المصدر: United Nations Conference on Trade and Development
      تم التحميل بواسطة: Knoema
      تم الوصول في: 18 تشرين الأول, 2024
      تحديد مجموعة بيانات
    • آب 2024
      المصدر: United Nations Conference on Trade and Development
      تم التحميل بواسطة: Knoema
      تم الوصول في: 26 أيلول, 2024
      تحديد مجموعة بيانات
      This table shows exports, imports and sum/average of exports and imports as percentage of nominal gross domestic product (GDP). The indicators are calculated for trade in goods, trade in services and total trade in goods and services.
  • H
  • I
    • حزيران 2024
      المصدر: International Telecommunication Union
      تم التحميل بواسطة: Knoema
      تم الوصول في: 12 تموز, 2024
      تحديد مجموعة بيانات
      Data cited at: International Telecommunication Union-https://www.itu.int/en/ITU-D/Statistics/Pages/stat/default.aspx 
    • تشرين الأول 2024
      المصدر: International Monetary Fund
      تم التحميل بواسطة: Knoema
      تم الوصول في: 23 تشرين الأول, 2024
      تحديد مجموعة بيانات
      The latest World Economic Outlook reports stable but underwhelming global growth, with the balance of risks tilted to the downside. As monetary policy is eased amid continued disinflation, shifting gears is needed to ensure that fiscal policy is on a sustainable path and to rebuild fiscal buffers. Understanding the role of monetary policy in recent global disinflation, and the factors that influence the social acceptability of structural reforms, will be key to promoting stable and more rapid growth in the future.
    • تشرين الأول 2023
      المصدر: Coffee Board of India
      تم التحميل بواسطة: Knoema
      تم الوصول في: 19 كانون الثاني, 2024
      تحديد مجموعة بيانات
    • حزيران 2024
      المصدر: United Nations Industrial Development Organization
      تم التحميل بواسطة: Knoema
      تم الوصول في: 12 حزيران, 2024
      تحديد مجموعة بيانات
      The UNIDO Industrial Statistics Database at the 4-digit level of ISIC (INDSTAT4) contains highly disaggregated data on the manufacturing sector. Comparability of data over time and across the countries has been the main priority of developing and updating this database. INDSTAT4 offers a unique possibility of in-depth analysis of the structural transformation of economies over time.The database contains seven principle indicators of industrial statistics. The data are arranged at the 3- and 4-digit level of the International Standard Industrial Classification of All Economic Activities (ISIC) Revision 3  and 4 pertaining to the manufacturing, which comprises more than 150 manufacturing sectors and sub-sectors.The database contains following indicators of industrial statistics:Number of establishments.Number of employees.Wages and salaries.Output.Value added.Gross fixed capital formation.Number of female employees Note: Knoema calculated the indicator Productivity Data cited at- https://stat.unido.org/database/INDSTAT%204%202022,%20ISIC%20Revision%204
    • آذار 2025
      المصدر: U.S. Energy Information Administration
      تم التحميل بواسطة: Knoema
      تم الوصول في: 01 نيسان, 2025
      تحديد مجموعة بيانات
    • تشرين الأول 2024
      المصدر: Property Rights Alliance
      تم التحميل بواسطة: Knoema
      تم الوصول في: 24 تشرين الأول, 2024
      تحديد مجموعة بيانات
      The 2022 IPRI classifies 129 countries, representing 93.91% of the world population and 97.73% of the global GDP. The selection of countries was determined solely by the availability of sufficient data. The results continue to suggest that countries with high scores on the IPRI and its components also show high levels of income and development, indicating the positive relationship between a property rights regime and quality of life. The average score of the IPRI for 2022 is  5.19, where the Legal and Political Environment (LP) was the weakest component with a score of 5.06, followed by the Intellectual Property Rights (IPR) component with a score of 5.24; and quite close, the Physical Property Rights (PPR) was the strongest component with a score of 5.27  For the fourth consecutive year, we found a decrease in the overall score of the IPRI and this year, also for all of its components. Finland leads the IPRI (8.17) as well as its PPR component (8.53), while New Zealand leads the LP (8.76) and the USA the IPR component (8.73). Singapore ranks 2nd in its IPRI score (7.97) followed by Switzerland (7.94) and New Zealand (7.93).  
    • أيلول 2024
      المصدر: International Telecommunication Union
      تم التحميل بواسطة: Knoema
      تم الوصول في: 12 آذار, 2025
      تحديد مجموعة بيانات
      The Global Cybersecurity Index (GCI) is a trusted reference that measures the commitment of countries to cybersecurity at a global level – to raise awareness of the importance and different dimensions of the issue. As cybersecurity has a broad field of application, cutting across many industries and various sectors, each country’s level of development or engagement is assessed along five pillars – (i) Legal Measures, (ii) Technical Measures, (iii) Organizational Measures, (iv) Capacity Development, and (v) Cooperation – and then aggregated into an overall score.​ Based on a multi‐stakeholder approach and initiative, the GCI leverages the capacity and expertise of different organizations (see key partners below), with the objectives of improving the quality of the survey, fostering international cooperation, and promoting knowledge exchange on this topic. The ITU Global Cybersecurity Agenda (GCA)​ ​provides the general foundation and framework for the initiative.​
  • L
    • تشرين الثاني 2024
      المصدر: National Bureau of Statistics, Nigeria
      تم التحميل بواسطة: Knoema
      تم الوصول في: 29 تشرين الثاني, 2024
      تحديد مجموعة بيانات
      Abridged Labor Force Survey Under Covid-19 
    • شباط 2023
      المصدر: Legatum Institute
      تم التحميل بواسطة: Knoema
      تم الوصول في: 27 آذار, 2023
      تحديد مجموعة بيانات
    • نيسان 2023
      المصدر: World Bank
      تم التحميل بواسطة: Knoema
      تم الوصول في: 22 أيار, 2023
      تحديد مجموعة بيانات
      The Logistics Performance Index overall score reflects assessments of a country's logistics based on efficiency of the customs clearance process, quality of trade- and transport-related infrastructure, ease of arranging competitively priced shipments, quality of logistics services, ability to track and trace consignments, and frequency with which shipments reach the consignee within the scheduled time. The index ranges from 1 to 5, with a higher score representing better performance. Data are from Logistics Performance Index surveys conducted by the World Bank in partnership with academic and international institutions and private companies and individuals engaged in international logistics. 2011 round of surveys covered more than 6,000 country assessments by nearly 1,000 international freight forwarders. Respondents evaluated eight markets on six core dimensions using a scale from 1 (worst) to 5 (best). The markets are chosen based on the most important export and import markets of the respondent's country, random selection, and, for landlocked countries, neighboring countries that connect them with international markets. Scores for the six areas are averaged across all respondents and aggregated to a single score using principal components analysis. Details of the survey methodology and index construction methodology are in Connecting to Compete 2012: Trade Logistics in the Global Economy (2012).
  • M
    • كانون الثاني 2017
      المصدر: Eurostat
      تم التحميل بواسطة: Knoema
      تم الوصول في: 05 شباط, 2017
      تحديد مجموعة بيانات
      The Structure of Earnings Survey (SES) is a 4-yearly survey which provides EU-wide harmonised structural data on gross earnings, hours paid and annual days of paid holiday leave, which are collected every four years under Council Regulation (EC) No 530/1999 concerning structural statistics on earnings and on labour costs, and Commission Regulation (EC) No 1738/2005 amending Regulation (EC) No 1916/2000 as regards the definition and transmission of information on the structure of earnings. The objective of this legislation is so that National Statistical Institutes (NSIs) provide accurate and harmonised data on earnings in EU Member States and other countries for policy-making and research purposes. The SES 2010 provides detailed and comparable information on relationships between the level of hourly, monthly and annual remuneration, personal characteristics of employees (sex, age, occupation, length of service, highest educational level attained, etc.) and their employer (economic activity, size and economic control of the enterprise). Regional data is also available for some countries and regional metadata is identical to that provided for national data.
    • تشرين الأول 2024
      المصدر: United Nations Conference on Trade and Development
      تم التحميل بواسطة: Divyashree T S
      تم الوصول في: 24 كانون الثاني, 2025
      تحديد مجموعة بيانات
    • تشرين الأول 2024
      المصدر: United Nations Conference on Trade and Development
      تم التحميل بواسطة: Knoema
      تم الوصول في: 24 آذار, 2025
      تحديد مجموعة بيانات
      This Dataset presents product concentration and diversification indices.  The diversification index indicates whether the structure of exports or imports by product of a given country or country group differs from the world pattern. The product concentration index shows how exports and imports of individual countries or country groups are concentrated on a few products or otherwise distributed in a more homogeneous manner among a series of products.
    • حزيران 2024
      المصدر: United Nations Conference on Trade and Development
      تم التحميل بواسطة: Knoema
      تم الوصول في: 26 تموز, 2024
      تحديد مجموعة بيانات
      This dataset shows statistics on the international maritime transport. It contains data on the size of the world merchant fleet by flag of registration and by type of ship. Data are presented in thousands of dead-weight tons (DWT).The dataset presents also, for each region or country 1) its share in the world fleet, and 2) the share of a ship-type in its fleet. From 2011 onwards, the figures on numbers of ships are also available, as well as the data in gross tonnage (GT).   This table contains consolidated time series from various issues of the UNCTAD Review of Maritime Transport. The Review reports on the worldwide evolution of shipping, ports and multimodal transport related to the major traffics of liquid bulk, dry bulk and containers. Please see http://unctad.org/rmt.   The data refer to the beginning of an indicated year.   The figures cover seagoing propelled merchant ships of 100 gross tons and above, excluding inland waterway vessels, fishing vessels (from 2011 onwards only), military vessels, yachts, and offshore fixed and mobile platforms and barges (with the exception of FPSO - floating production, storage and offloading vessels - and drillships). Break in series: from 2011 onwards - (a) data also include the United States and Canada Great Lakes fleets; and (b) figures no longer cover the fishing vessels.
  • N
    • كانون الثاني 2025
      المصدر: United Nations Statistics Division
      تم التحميل بواسطة: Knoema
      تم الوصول في: 22 كانون الثاني, 2025
      تحديد مجموعة بيانات
      The National Accounts Main Aggregates Database presents a series of analytical national accounts tables from 1970 onwards for more than 200 countries and areas of the world. It is the product of a global cooperation effort between the Economic Statistics Branch of the United Nations Statistics Division, international statistical agencies and the national statistical services of these countries and is developed in accordance with the recommendation of the Statistical Commission at its first session in 1947 that the Statistics Division should publish regularly the most recent available data on national accounts for as many countries and areas as possible. The database is updated in December of each year with newly available national accounts data for all countries and areas.
    • تشرين الأول 2024
      المصدر: United Nations Statistics Division
      تم التحميل بواسطة: Knoema
      تم الوصول في: 24 تشرين الأول, 2024
      تحديد مجموعة بيانات
      Different series numbers (column “Series”) are used to store different time-series versions of national accounts statistics. Series numbers with two digits (10,20) refer to data compiled following the SNA 1968 national accounts methodology, while series numbers with three digits (100, 200, etc) refer to data compiled using the SNA 1993 national accounts methodology whereas series number with four digits (1000, 1100) refer to data compiled using the SNA 2008 national accounts methodology. In addition to different methodologies, different series numbers are used when data are reported in different currencies, fiscal years, or by different sources. Furthermore, data are stored under a new series number whenever there are significant changes in compilation practices which make the time series no longer comparable. Note: Ethiopia [upto 1993] and Ethiopia [from 1993] merged to get Ethiopia, Similarly Sudan (upto 2011) is combined with Sudan.
    • كانون الأول 2024
      المصدر: World Health Organization
      تم التحميل بواسطة: Knoema
      تم الوصول في: 12 كانون الأول, 2024
      تحديد مجموعة بيانات
      National Health Accounts (NHA) provides evidence to monitor trends in health spending for all sectors- public and private, different health care activities, providers, diseases, population groups and regions in a country. It helps in developing nationals
  • P
    • كانون الثاني 2023
      المصدر: University of Groningen, Netherlands
      تم التحميل بواسطة: Felix Maru
      تم الوصول في: 01 شباط, 2023
      تحديد مجموعة بيانات
    • آذار 2009
      المصدر: Eurostat
      تم التحميل بواسطة: Knoema
      تم الوصول في: 25 كانون الثاني, 2025
      تحديد مجموعة بيانات
      Eurostat Dataset Id:cens_01rews The tables presented in the topic of educational level cover the total population for 31 countries (for more information on received tables and geographic coverage, see "2001 Census Round - Tables Received" in the Annex at the bottom of the page). The level of completeness of the tables depends largely on the availability of data at the respective national statistical institutes. There are four ways of collecting census data, namely: - the traditional method of using census questionnaires (exhaustive census); - the method of using registers and/or other administrative sources; - a combination of registers and/or other administrative sources and - surveys (complete enumerations or sample surveys). Other methods (other mixed census or micro-census) can be used as well. Details for the method employed by each country are provided in "2001 Census Method"in the Annex at the bottom of the page. In the same table you can find the dates on which the census was carried out in each country.
    • آذار 2025
      المصدر: World Bank
      تم التحميل بواسطة: Knoema
      تم الوصول في: 26 آذار, 2025
      تحديد مجموعة بيانات
      The World Bank updated the global poverty lines in September 2022. The Poverty data are now expressed in 2017 Purchasing Power Parity (PPP) prices, versus 2011 PPP in previous editions. The new global poverty lines of $2.15, $3.65, and $6.85 reflect the typical national poverty lines of low-income, lower-middle-income, and upper-middle-income countries in 2017 prices.
  • R
  • S
    • تموز 2024
      المصدر: United Nations Conference on Trade and Development
      تم التحميل بواسطة: Knoema
      تم الوصول في: 05 أيلول, 2024
      تحديد مجموعة بيانات
      This Dataset contains new preliminary annual estimates on international trade in services, based on the most recent quarterly figures. The underlying sources and methodology are different to previously used by UNCTAD and those used in the table containing the longer series of annual trade-in-services statistics. Consequently, the two data sets should not be merged or used interchangeably. The preliminary figures and derived growth rates included in this new series should be given priority as they are more up-to-date. However, users are advised that when the final annual data are published in May, these should be treated as the definitive series. The data in the table entitled "Services (BPM6): Exports and imports by service-category and by trade-partner” are kept on the web for users who require information on detailed services' sub-items or longer time-series.
    • حزيران 2024
      المصدر: Sustainable Development Solutions Network
      تم التحميل بواسطة: Knoema
      تم الوصول في: 19 حزيران, 2024
      تحديد مجموعة بيانات
      Data Cited at - Sachs, J., Schmidt-Traub, G., Kroll, C., Lafortune, G., Fuller, G. (2019): Sustainable Development Report 2019. New York: Bertelsmann Stiftung and Sustainable Development Solutions Network (SDSN). The Sustainable Development Report 2020 presents the SDG Index and Dashboards for all UN member states and frames the implementation of the Sustainable Development Goals (SDGs) in terms of six broad transformations. It was prepared by teams of independent experts at the Sustainable Development Solutions Network (SDSN) and the Bertelsmann Stiftung.
    • حزيران 2024
      المصدر: United Nations Statistics Division
      تم التحميل بواسطة: Knoema
      تم الوصول في: 17 تموز, 2024
      تحديد مجموعة بيانات
  • T
    • تشرين الأول 2024
      المصدر: Statistics Botswana
      تم التحميل بواسطة: Knoema
      تم الوصول في: 15 تشرين الثاني, 2024
      تحديد مجموعة بيانات
      Data cited at: https://botswana.opendataforafrica.org/stuwedg Tourism Statistics by country of origin, Botswana
    • أيار 2024
      المصدر: World Economic Forum
      تم التحميل بواسطة: Felix Maru
      تم الوصول في: 06 حزيران, 2024
      تحديد مجموعة بيانات
      The rise of travel and tourism has shown significant resilience globally. Despite slow economic growth in advanced economies and geopolitical tensions in some regions, the T&T sector still accounts for a large part of the global economy (estimated to be approximately 9% of global GDP or US$ 7 trillion) and employment, while the number of international travelers continues to increase. According to the World Travel & Tourism Council (WTTC), the T&T sector is forecast to continue growing at 4% annually—faster than financial services, transport and manufacturing
  • U
    • كانون الأول 2024
      المصدر: United Nations Statistics Division
      تم التحميل بواسطة: Knoema
      تم الوصول في: 27 كانون الثاني, 2025
      تحديد مجموعة بيانات
      The Energy Statistics Database contains comprehensive energy statistics on the production, trade, conversion and final consumption of primary and secondary; conventional and unconventional; and new and renewable sources of energy. The Energy Statistics dataset, covering the period from 1990 onwards, is available at UNdata
    • تشرين الثاني 2023
      المصدر: World Tourism Organization
      تم التحميل بواسطة: Knoema
      تم الوصول في: 30 نيسان, 2024
      تحديد مجموعة بيانات
  • W
    • آب 2024
      المصدر: World Economics and Politics (WEP) Dataverse
      تم التحميل بواسطة: Knoema
      تم الوصول في: 04 أيلول, 2024
      تحديد مجموعة بيانات
    • تموز 2023
      المصدر: World Health Organization
      تم التحميل بواسطة: Knoema
      تم الوصول في: 02 آب, 2023
      تحديد مجموعة بيانات
      Estimates on the use of water, sanitation and hygiene by country (2000-2020)
    • آب 2023
      المصدر: United Nations Environment Programme
      تم التحميل بواسطة: Knoema
      تم الوصول في: 22 آب, 2023
      تحديد مجموعة بيانات
    • آذار 2025
      المصدر: Sustainable Development Solutions Network
      تم التحميل بواسطة: Knoema
      تم الوصول في: 08 نيسان, 2025
      تحديد مجموعة بيانات
      The World Happiness Report is a landmark survey of the state of global happiness that ranks 156 countries by how happy their citizens perceive themselves to be. The World Happiness Report 2020 for the first time ranks cities around the world by their subjective well-being and digs more deeply into how the social, urban and natural environments combine to affect our happiness.
    • حزيران 2024
      المصدر: United Nations Conference on Trade and Development
      تم التحميل بواسطة: Knoema
      تم الوصول في: 09 تموز, 2024
      تحديد مجموعة بيانات
      The World Investment Report focuses on trends in foreign direct investment (FDI) worldwide, at the regional and country levels and emerging measures to improve its contribution to development. This Report further focuses on:Analysis of the trends in FDI during the previous year, with especial emphasis on the development implications.Ranking of the largest transnational corporations in the world.In-depth analysis of a selected topic related to FDI.Policy analysis and recommendations.Statistical annex with data on FDI flows and stocks for 196 economies.
    • كانون الأول 2024
      المصدر: World Health Organization
      تم التحميل بواسطة: Knoema
      تم الوصول في: 24 كانون الأول, 2024
      تحديد مجموعة بيانات
      Globally, there were an estimated 247 million malaria cases in 2021 in 84 malaria endemic countries (including the territory of French Guiana), an increase from 245 million in 2020, with most of this increase coming from countries in the WHO African Region. In 2015, the baseline year of the Global technical strategy for malaria 2016–2030 (GTS), there were an estimated 230 million malaria cases.The proportion of cases due to Plasmodium vivax reduced from about 8% (20.5 million) in 2000 to 2% (4.9 million) in 2021.Malaria case incidence (i.e. cases per 1000 population at risk) reduced from 82 in 2000 to 57 in 2019, before increasing to 59 in 2020. There was no change in case incidence between 2020 and 2021. The increase in 2020 was associated with disruption to services during the COVID-19 pandemic.Twenty-nine countries accounted for 96% of malaria cases globally, and four countries – Nigeria (27%), the Democratic Republic of the Congo (12%), Uganda (5%) and Mozambique (4%) – accounted for almost half of all cases globally.The WHO African Region, with an estimated 234 million cases in 2021, accounted for about 95% of global cases.
    • أيار 2018
      المصدر: United Nations Department of Economic and Social Affairs
      تم التحميل بواسطة: Knoema
      تم الوصول في: 26 حزيران, 2018
      تحديد مجموعة بيانات
      The 2018 Revision of World Urbanization Prospects presents the latest United Nations estimates of the size of urban and rural populations for 233 countries or areas from 1950 to 2018, with projections until 2050. It also includes data on population size for close to 1900 urban settlements having 300000 inhabitants or more in 2018. These 1900 cities or urban areas are now home to nearly 60 per cent of the world’s urban population.
    • كانون الأول 2023
      المصدر: United Nations Conference on Trade and Development
      تم التحميل بواسطة: Jonathan Kilach
      تم الوصول في: 25 تموز, 2024
      تحديد مجموعة بيانات
      The dataset presents the total number of containers handled by a port, per country, expressed in twenty-foot equivalent units (TEUs). A TEU represents the volume of a standard 20 feet long intermodal container used for loading, unloading, repositioning and transshipment. A 40-foot intermodal container is counted as two TEUs. Maritime Transport Indicators: Container Port Throughput, Annual, 2010-2020 NB: Sudan values prior to 2011 are before secession of South Sudan TRANSLATE with xEnglishArabicHebrewPolishBulgarianHindiPortugueseCatalanHmong DawRomanianChinese SimplifiedHungarianRussianChinese TraditionalIndonesianSlovakCzechItalianSlovenianDanishJapaneseSpanishDutchKlingonSwedishEnglishKoreanThaiEstonianLatvianTurkishFinnishLithuanianUkrainianFrenchMalayUrduGermanMalteseVietnameseGreekNorwegianWelshHaitian CreolePersian  TRANSLATE with COPY THE URL BELOW BackEMBED THE SNIPPET BELOW IN YOUR SITEEnable collaborative features and customize widget: Bing Webmaster PortalBack
  • ا