The decrease in the national crime rate in the US during the past two decades was insufficient to offset the cost to US taxpayers to manage prisons because of the simultaneous increase in the rate of incarceration during the period. Between 1991 and 2013, the national crime rate fell from 1,311 to 689 offenses per 100,000 people. In absolute terms, 8.5 million fewer crimes were committed in 2013 compared to 1991. While the crime rate decreased, the number of state inmates grew by 200 percent nationwide, reaching a total incarcerated population of 1.6 million in 2008. Another 723,131 inmates were confined in local jails for a total adult inmate population of 2.3 million, or roughly 1 in 100 adults in the United States.

These trends in US criminal justice have come at a cost to American taxpayers. State corrections budgets have nearly quadrupled in the past two decades. Despite this alarming figure, official correction budgets account for only a portion of the financial obligations a state incurs when it sentences an individual to prison. The Vera Institute of Justice estimates that the total taxpayer cost of prisons, including additional indirect costs that fall outside correction budgets, was $39 billion in 2010. This is $5.4 billion more than official $33.5 billion total spending of state correction departments. These indirect costs vary widely, according to the Vera Institute, from 1 percent of the total cost of prisons in Arizona to 34 percent in Connecticut.

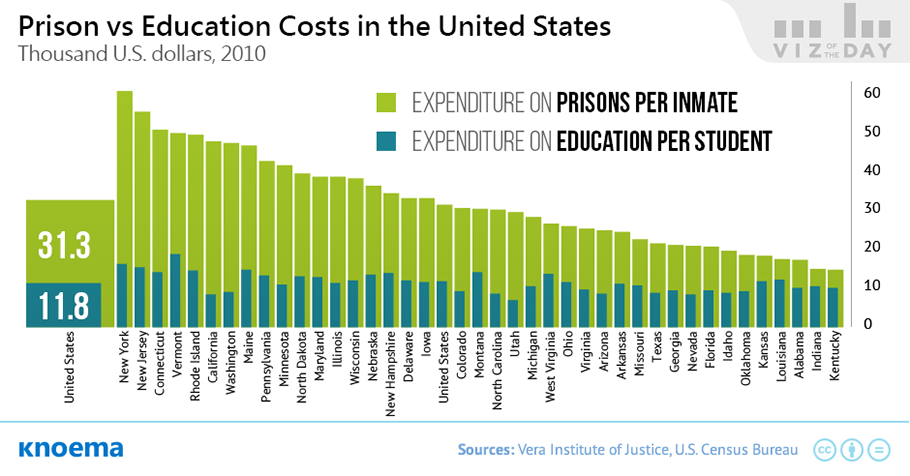
The relative modern day cost of incarceration in the US relative to public expenditures on elementary-secondary education strongly supports social policy planning that puts education first. Assuming that the total number of people imprisoned in the United States was 1.2 million in 2010, the average per-inmate cost was $31,286 and ranged from $14,603 in Kentucky to $60,076 in New York. In contrast, the US government spent $602 billion on the nearly 50 million elementary-secondary students in public schools in the US in 2010, or about $12,800 per student, according to the US Census Bureau. This is more than two times less than was spent on average per inmate.

رؤى ذات صلة من Knoema

Active Hate Groups in the United States, 2003-2015

In 2015, at least 892 "hate" groups were operating throughout the United States, according to Southern Poverty Law Center (SPLC). This represents a 14 percent increase from the 784 groups recorded a year before. Still, the current figures are lower than the all-time high in 2011 as traditional organised extremism continues to shrink in favor of collective and individual cyber-based activism. The SPLC defines a hate group as an organised movement that has beliefs or practices that attack or malign an entire class of people based on religion, race, sexual orientation, gender,...

Police Shootings in the United States

The shooting death of Philando Castile by police in Falcon Heights, Minnesota, on 7 July pushed the issue of the use of deadly force by police back into national headlines and ignited protests throughout the United States. Data collected by the Washington Post on US police shootings suggests that the use of deadly force is on the rise. So far this year 512 people have been shot and killed by police in the United States. This is a three-percent increase - or, 16 more deaths - than the same period of 2015 and roughly equal to the number of people that have been killed this year in...

Mass Shootings in the United States

The conversation in the United States has returned to an all too familiar topic, “the latest mass shooting,” a reference to the attack by Stephen Paddock on an outdoor music venue in Las Vegas, Nevada, on the evening of 1 October 2018. Paddock murdered 59 people and injured another 241 people. To date in 2018, the US has experienced 426 mass shootings, in which 362 people have been killed and another 1,289 injured.Data also shows that during the last five years, the deadliest states—California, Florida, Texas, and Illinois—also have the largest distribution of...

United States: Higher Education Costs Flat in 2018

In 2018, not only did tuition rates for US higher education hold relatively flat, but US state and local government spending on higher education grew in line with inflation for a total contribution of $99 billion, according to the State Higher Education Executive Officers Association. Government funding for higher education tumbled in the aftermath of the 2007-2008 global financial crisis, but has since rebounded, growing approximately 20 percent in the last 5 years. Some would argue that while these trends are positive, they are not enough. With an increasing focus on...