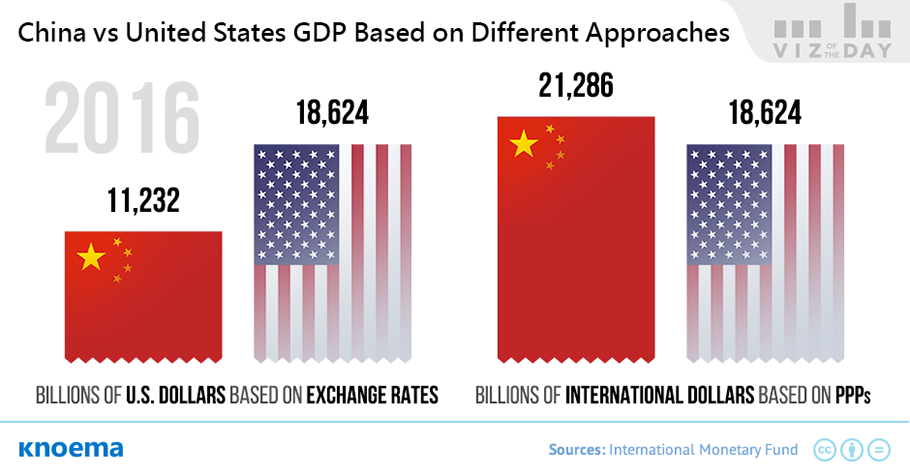
Which is the world's largest economy, China or the United States? As is usual in the field of economics, “It depends.” It depends on the methods used to estimate the size of an economy and to compare one economy to another. Despite modern discussions on refining the calculation of gross domestic product (GDP), the standard measure of an economy’s size and performance, to be more inclusive of economic factors that have been ignored to date, such as environmental and natural resource depletion, there is no commonly accepted alternative to GDP. There are, however, at least two commonly used approaches to cross-country comparisons of GDP.

Method 1 - Current exchange rates. The GDP of two economies measured in each country’s national currency can be compared by converting the value of each GDP into a common third currency, such as US dollars, based on the current exchange rate. While the more popular approach, it is flawed. Official exchange rates differ from the real value of national currencies because currencies are not only exchanged to buy and sell goods and services in trade but are also used as investment instruments. As investment tools, currency valuations thus fall prey to speculation and irrational expectations of investors versus pure market fundamentals that are the basis for official rates.

Example. Based on the current ¥/$ exchange rate, if a bottle of Coca-Cola costs $1 in the United States it would cost ¥6.63 in China. Only, it wouldn't actually cost that much because the real value of the yuan relative to the dollar differs from the official exchange rate.

Method 2 - Purchasing power parity. Alternatively, the values of the national currencies of two economies can be converted to a single international currency — known as international dollars — using purchasing power parities (PPPs). PPPs are essentially the currency conversion rates that eliminate differences in price levels between countries and equalize the purchasing power of different countries. It is calculated as the ratio of the price of the same good in different countries in local currencies. 

Example. If a bottle of Coca-Cola costs ¥3.5 in China and $1 in the United States then the PPP for Coca-Cola between these countries is ¥3.5/$1 = 3.5.

If you calculate the PPP for every good and service produced and average the values, you can calculate the PPP for the GDPs between two countries. Let’s return then to the question of whether the US or China has a larger economy. According to the IMF, in 2019, the PPP between China and the US was ¥3.5 per international dollar. As such, China’s GDP of ¥95.5 trillion would be worth $27.3 trillion in the United States (¥74.6/3.5). That’s $5.9 trillion, or nearly 28 percent, more than the US GDP of $21.4 trillion in 2019.

So, to answer the original question, China is the world's largest economy, followed by the United States ... if you compare GDPs based on PPP.

Coronavirus Data and Insights

Live data and insights on Coronavirus around the world, including detailed statistics for the US, EU, and China — confirmed and recovered cases, deaths, alternative data on economic activities, customer behavior, supply chains, and more.

رؤى ذات صلة من Knoema

China: Negative GDP Growth for First Time in 44 Years | The Latest Official Statistics

(17 April 2020) Chinese GDP contracted 6.8 percent in the first quarter of 2020 according to China's National Bureau of Statistics. While it is the first decline in the history of quarterly GDP growth records, which date back to 1993, annual GDP, which has a longer history, dropped below zero once before in 1976. It is still unclear whether the Chinese economy will register a decline at the end of 2020. According to the IMF's latest World Economic Outlook, China is among the critical few economies that are still projected to grow in 2020. China's rapid economic downturn is tied to...

How Deep an Economic Decline Can the World Expect in 2020?

For the first time during the post World War II era, the global economy is expected to shrink due to measures in force worldwide to suppress the coronavirus, according to the IMF World Economic Outlook (WEO) released on April 14, 2020. In this edition of the WEO, the IMF shortened the forecast horizon to 2021 instead of the expected 2025 horizon and limited the number of indicators available in its statistical tables because of the high level of uncertainty in current global economic conditions. In the baseline scenario—which assumes that the pandemic fades in the second half of...

IMF Global Growth Projections | More Optimism Amidst New Fiscal Stimulus

(8 April 2021) Amid COVID-19 vaccination progress and new stimulus measures from the US government, IMF economists are predicting a shining near-term future for the global economy. Here are the key takeaways from the April 2021 edition of the IMF's World Economic Outlook (WEO) report: The IMF now estimates 2020 growth to have been -3.3 percent, a 1.1 percentage point upward revision from its October 2020 projection. The outlook for 2021 improved by 0.8 percentage points, to 6%, based on expected additional fiscal support in the US and other large economies and anticipated...

Knoema Global Economic Outlook | Q2 2020 Explained

(14 October 2020) The corona-crisis is different from past economic recessions in that it has touched all economies without exception. But if we look from economy to economy, we quickly observe that the economic consequences of the corona-crisis are far from uniform. To understand why, for example, GDP in Korea dropped just 2.8% YoY in Q2 2020 while India experienced a 23.9% YoY contraction, we collected key macroeconomic indicators for Q2 2020 for the world's 15 largest economies. At first blush the data was disappointing, because the economic strain appeared again to be rather...